
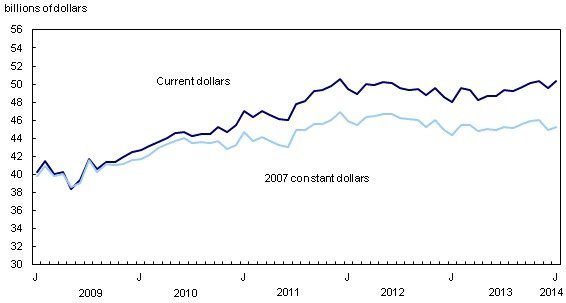
Sales of Canadian manufactured goods rose 1.5 per cent to $50.4 billion in January, Statistics Canada reports. Most of the higher sales were in food, primary metal, and miscellaneous industries. It was the highest gain since February of 2013. On a year-over –year basis, January sales were up 5 per cent. Altogether, sales were up in twelve of the twenty-one industries tracked, including durable and non-durable goods.
Primary metals, including iron and steel mill output, and ferro-alloy manufacturers, jumped 8 per cent, to $3.8 billion. Higher prices were also a factor in the increase.
The largest category gains were in miscellaneous manufacturing, where sales rose 20.3 per cent to $1.1 billion in January, after a drop of 11.8 per cent in December. Miscellaneous manufacturing refers to a range of products that includes medical equipment and supplies, jewelry, sporting goods, toys, and office supplies, and any other manufactured goods not classified in another subsector.
Inventories rose 3.6 per cent in January, led by the aerospace industry, where product and parts inventories rose 6.7 per cent to the highest level ($8.1 billion) since in eighteen months. Petroleum and coal products inventories rose 6.2 per cent to their second highest level ($6.2 billion) on record.
Unfilled orders also rose in January (up 4.8 per cent to $78.4 billion) after a drop of almost the same percentage in December. Most of this increase, more than three-quarters, was as a result of unfilled orders in aerospace products and parts. Unfilled aerospace orders rose 6 per cent, to $48.1 billion. Unfilled aerospace orders have been rising since they reached a low of just $20.7 billion in December, 2010.
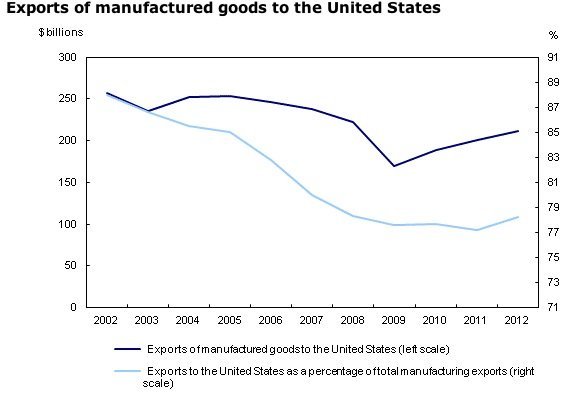
Exports of manufactured goods fell 2002–2012
A separate Statistics Canada report on the export of Canada’s manufactured goods shows a changing trade picture over the ten years from 2002 to 2012. During that time, exports fell by more than 7 per cent, or $20.7 billion. The biggest decrease was in exports to the United States, Canada’s traditional largest trading partner. US imports of Canadian goods fell by $44.8 billion in that time. As well, the share of Canada’s manufacturing exports to the US dropped by 10 per cent.
However, exports to other countries increased during the same period, rising by $24.1 billion, the biggest increase going to China. China’s imports of Canadian goods more than tripled in the ten years, moving China into second place as a purchaser of Canadian manufactured goods. China’s share of the total rose from 0.9 per cent to 3.5 per cent. The biggest growth in exports to China was in paper, wood and food products.
In all, the rest of the world’s share of Canadian manufacturing exports rose by almost exactly the same percentage as the United States’ share shrank, growing from 12 per cent in 2002 to 21.8 per cent in 2012.
Exports to the European Union were up as well, accounting for the second largest increase, after China. Exports to the EU were up nearly $5 billion in 2012 over 2002 levels.


